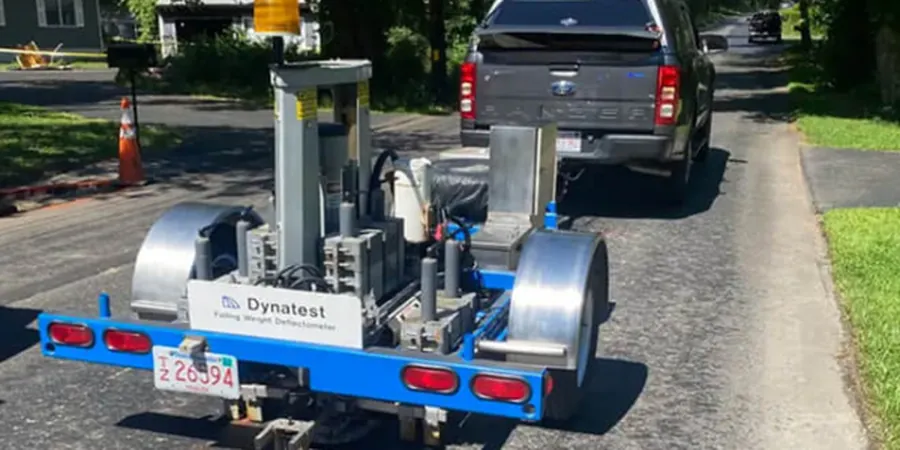
We use a Falling Weight Deflectometer (FWD) and a 60-kN hydraulic coring rig to assess existing pavement structures in Irvine. The FWD applies a 40-kN impulse load to simulate traffic, measuring deflection basins at 9 sensors. Cores of 150 mm diameter are extracted for layer thickness verification and laboratory testing. This combination yields a reliable structural number for each section. Irvine's pavement network includes both flexible asphalt and rigid concrete sections. Our team coordinates with OC Public Works for lane closures and traffic management. We process field data using AASHTO 1993 and mechanistic-empirical methods. The evaluation pinpoints weak subgrade zones before overlay design begins.
FWD deflection basins combined with core thickness data provide a structural number accuracy within 5% for overlay design in Irvine.
Methodology and scope
- Resilient modulus (Mr) per AASHTO T-307
- Unconfined compressive strength on core asphalt
- Gradation and Atterberg limits on subgrade samples
- In-situ density by sand cone per ASTM D1556
Local considerations
A 4-lane arterial in the Irvine Business Complex showed severe alligator cracking after only 8 years of service. The original pavement had no subgrade drainage layer. Spring rains caused moisture buildup in the silty sand subgrade, reducing its resilient modulus by nearly 40%. Our evaluation identified a structural number deficit of 2.1 inches. The solution required a 4-inch asphalt overlay with a geocomposite drain interlayer. Without this evaluation the overlay would have failed within 3 years. Early detection of the drainage issue saved the city from a full-depth reconstruction cost of nearly $2 million.
Applicable standards
ASTM D4694-09 (FWD deflection), AASHTO T-307 (Resilient modulus), ASTM D1586-18 (SPT for subgrade), Caltrans HDM Chapter 610, ASTM D3549-19 (Core thickness)
Associated technical services
FWD Deflection Testing
Traffic-speed FWD runs on all lanes. Back-calculation of layer moduli using ELMOD or EVERCALC. Reports include deflection basin parameters and structural number.
Pavement Coring & Profiling
Wet or dry coring through asphalt and concrete. Layer thickness, core integrity, and interlayer bond assessment. Samples sent for mix design verification.
Subgrade Soil Investigation
Test pits or hand augers to 1.5 m depth. In-situ density, moisture content, and classification. CBR or resilient modulus for subgrade strength evaluation.
Rehabilitation Design
Remaining life analysis per AASHTO 1993 and MEPDG. Overlay thickness design, mill depth recommendation, and drainage improvement specs. Delivered as sealed engineering report.
Typical parameters
Frequently asked questions
What is the typical cost range for an existing pavement evaluation in Irvine?
A standard evaluation for a 2-lane section of 1 mile costs between US$1,310 and US$4,190 depending on FWD points, number of cores, and laboratory testing. Full arterial studies with multiple sections fall at the higher end.
How long does an FWD test take per mile?
Traffic-speed FWD testing covers approximately 1 mile per hour including setup and data download. Stop-and-go testing at 500-ft intervals takes 3–4 hours per mile. Results are available within 5 business days.
What is the difference between structural number and remaining life?
Structural number (SN) is the calculated load-carrying capacity of the pavement layers combined. Remaining life estimates the percentage of design traffic that the existing pavement can still carry before reaching terminal serviceability. Both are derived from FWD data and layer thickness.
Do you coordinate with Irvine city or OC Public Works for traffic control?
Yes. We manage all permit applications for lane closures on city and county roads. Our traffic control plan follows Caltrans MUTCD standards. We provide a minimum 2-week notice to coordinate with local construction schedules.